How Data Can Save You Money in Workplace Catering
Most workplace restaurants don’t lose money because the food is “bad.” They lose money because decisions are made with partial information: assumptions about what people want, rough guesses about peak moments, and reactive changes after complaints. Data changes that. When you can see demand, behaviour, and performance, you stop spending on fixes and start investing in improvements that pay back.
1) Know your customers (so you stop funding the wrong offer)
If you don’t know who is actually using your restaurant—and what they choose—you end up with a food offer built on opinions.
With simple, consistent data (sales mix, attendance, preferences, satisfaction, dietary patterns), you can:
· Align the menu with real demand (and reduce overproduction)
· Identify “hero” items that drive tray value
· Spot gaps (e.g., too few grab-and-go options, not enough plant-forward choices)
· Reduce complexity that creates waste, slow service, and higher labour pressure
Money saved: fewer low-rotation items, fewer last-minute changes, less waste, and better purchasing accuracy.
2) Build the right food offer (and reduce food waste at the source)
Food waste is rarely a kitchen problem only. It’s usually a planning problem.
When you track production vs. sales per category (and per daypart), you can:
· Forecast volumes more accurately
· Adjust batch sizes and replenishment rules
· Replace “always available” with “available when it matters”
· Improve recipe standardisation and portion control
Money saved: lower food cost, lower disposal cost, and fewer emergency purchases.
3) Design the freeflow around the offer (avoid waste in investment)
Many self-service and freeflow areas are built first—and then the food offer is forced to fit. That’s expensive.
Use data to design the layout around real behaviour:
· What stations create queues?
· Where do people hesitate or turn back?
· Which categories are chosen together (and should be placed together)?
· What time windows create congestion?
When the freeflow matches the offer, you avoid:
· Overbuilding stations you don’t need
· Rebuilding later because the flow doesn’t work
· Buying equipment that doesn’t match demand
Money saved: fewer “corrections” after launch, fewer capex mistakes, and better throughput without expanding space.
4) Put staff where it matters (not where it’s always been)
Labour is one of your biggest controllable costs—and also one of the easiest to misallocate.
With footfall and transaction data by time slot, you can:
· Staff peaks precisely (instead of overstaffing the full service window)
· Move people to the bottleneck stations
· Reduce overtime and last-minute cover
· Improve productivity per labour hour
Money saved: better labour efficiency without compromising service.
5) Analyse your flow (because crowding is a revenue problem)
Some employees avoid company restaurants for one simple reason: it feels too crowded.
That’s lost revenue you rarely see in a P&L line—because it shows up as “lower attendance,” not as “queue avoidance.”
When you measure flow (queue time, throughput, station congestion, peak compression), you can:
· Reduce waiting time without adding staff
· Spread demand with smarter timing and communication
· Improve layout decisions (entry/exit, payment, pick-up points)
Money gained: higher attendance, higher tray value, and better satisfaction.
6) Communicate with precision (avoid noise, drive the right behaviour)
Most catering communication is too broad: “Today’s menu…” “New concept…” “Please don’t…”
Data lets you communicate to the point:
· Promote the items that need volume (to balance production)
· Nudge behaviour that reduces congestion (timing, station choice)
· Target messages by site, day, or audience segment
Money saved and earned: less waste, smoother peaks, and more uptake of profitable items.
7) Satisfaction is not a ‘nice to have’—it’s a cost lever
Satisfaction impacts:
· Attendance (and therefore revenue)
· Complaint handling time
· Rework and reactive changes
· Trust in the service
Track satisfaction consistently and connect it to operational drivers:
· Which sites are underperforming and why?
· Which changes improved satisfaction and reduced cost?
· Where is the gap between perception and reality?
A simple way to do this is to run short, repeatable pulse surveys (monthly or quarterly) and link the results back to operational KPIs.
If you want to go deeper than “satisfaction scores,” CaterSurvey adds a layer that’s often missing in workplace catering: consumer profiling. It helps you understand the mix of profiles on each site—like grazers, traditionalists, budgeteers, and explorers—plus special segments such as generational groups, newcomers, and health-conscious consumers. That makes the data immediately usable: you can adjust the offer, the service style, and the communication to what people actually value.
Money gained: higher retention of users and fewer expensive “guess-and-fix” cycles.
8) A practical data loop that saves money (without heavy analytics)
You don’t need a data science team. You need a repeatable loop:
1. Measure: attendance, sales mix, waste, labour, satisfaction, flow
2. Benchmark: compare sites, suppliers, and trends over time
3. Decide: pick 1–3 actions with clear expected impact
4. Execute: assign owners and deadlines
5. Review: did it move the KPI? keep, adjust, or stop
This is how catering becomes manageable: visible, comparable, and actionable.
9) Turn flow insights into layout decisions (without expensive trial-and-error)
Flow improvements often get stuck at the same point: everyone agrees the restaurant is crowded, but changes feel risky—because you don’t know what will happen if you move a station, change the offer, or adjust the service sequence.
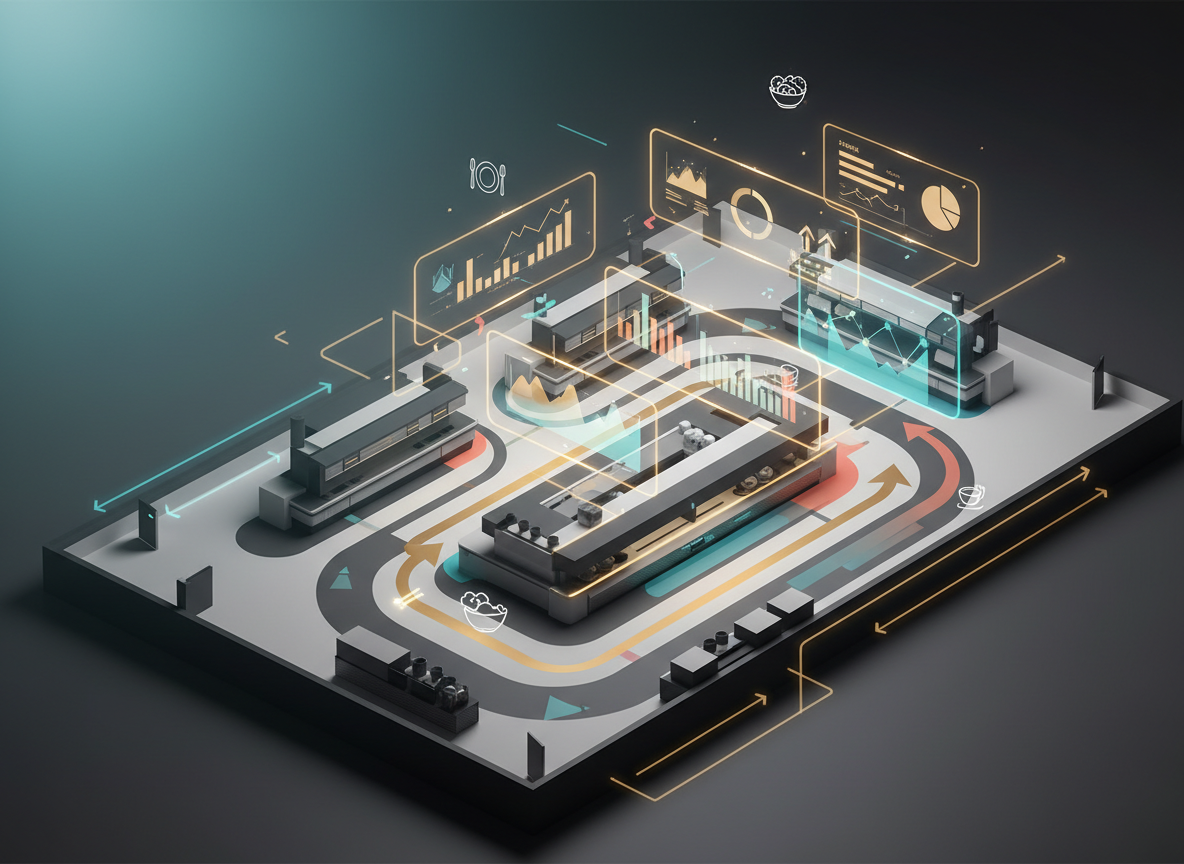
This is where structured flow analysis helps. Tools like CaterFlow can support the process by mapping the people flow and pressure points, so layout and freeflow decisions are based on evidence rather than “we think this might work.” The goal isn’t complexity—it’s avoiding costly changes and investments after the fact.
Money saved: fewer redesign cycles, fewer wrong equipment choices, and faster improvements with less disruption.
Quick wins to start this month
· Track waste by category (not just total) and cut the bottom 3 offenders
· Map your peak 30 minutes and identify the single biggest bottleneck station
· Compare tray value by day and align promotions to lift low days
· Move one staff member to the bottleneck for 2 weeks and measure queue time
· Reduce menu complexity by 10% and measure waste + satisfaction
The bottom line
Data saves money by preventing the most expensive thing in workplace catering: decisions made too late, based on assumptions.
When you know your customers, design the right offer, optimise the flow, and allocate staff where it matters, you reduce waste, avoid unnecessary investments, and increase revenue through better satisfaction and higher tray value.
If you want, I can add a short, non-salesy closing paragraph that invites readers to start with one metric (waste, queue time, or satisfaction) and build from there.
See your own restaurant's flow, backed by data
ALOHA CaterFlow simulates your company restaurant so you can cut queues, remove bottlenecks and get a boardroom-ready action plan in 2–3 weeks.
Get started